CreamSoda
Pricing
Resources
Pricing

Sales reporting software for B2B product sales

See sales results. Know where to focus.

See new opportunities, pipeline progress and won or lost deals. Compare sales results with recorded revenue and costs, then open the deals behind the numbers to decide what needs attention.

Get answers for your next sales review

See what is in the pipeline

Check open deal counts and values alongside won and lost results.

Are enough new deals coming in?

Track how many opportunities your team creates over time.

See where deals need a closer look

Review stage totals and conversion before checking the deals behind them.

Compare team results

See won and lost deals by salesperson and over time.

Look beyond the sales total

Review recorded revenue, purchasing costs and the other costs entered against deals.

See what remains after costs

See profit calculated from the revenue and costs recorded in CreamSoda.

Check payments before the next call

Review payments received and overdue invoices before discussing the next sale.
CreamSoda demo deals-created chart showing monthly opportunity counts

Know when the pipeline needs fresh opportunities

Are new deals coming in, or are you working the same few?
Track how many deals your team creates over time. Compare that with the open pipeline to decide whether to focus on finding new opportunities or moving existing ones forward. Charts show example data.

See which stages need attention

Where should you look first?
Review stage totals and conversion to see where to start. Then check the relevant deals and follow-up activity to understand what is happening.
CreamSoda demonstration sales conversion chart showing reported stage percentages
CreamSoda demo deals-won report comparing counts across three sales owners

Make team reviews more specific

Who is winning deals, and where are sales being lost?
Compare won and lost deal counts or values by salesperson and over time. Choose the date range and pipeline, then use the deal details to understand the results.

See what is left after recorded costs

How much of the sale remains after costs?
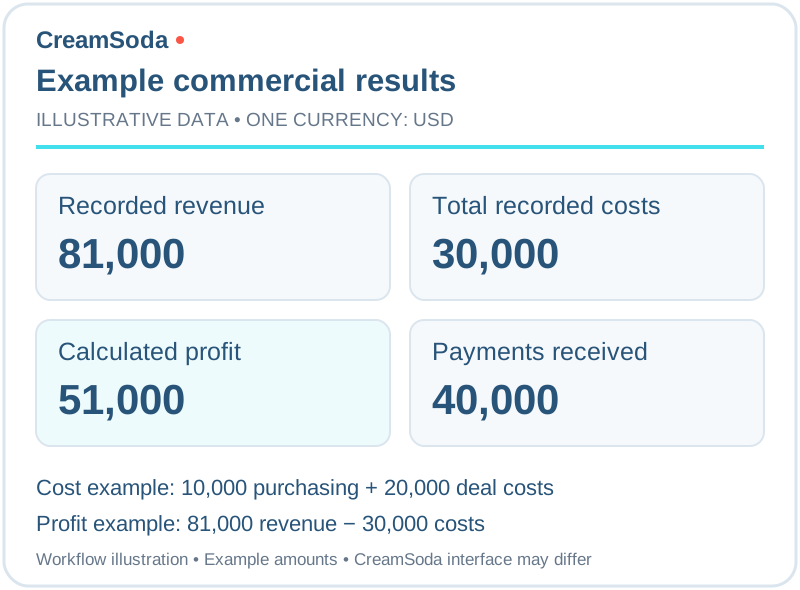
See recorded revenue, purchasing costs, other deal costs and calculated profit together. Check payments received alongside them. The figures reflect the entries your team keeps in CreamSoda.
Single-currency illustration of recorded revenue, purchase and deal costs, calculated profit and payments received
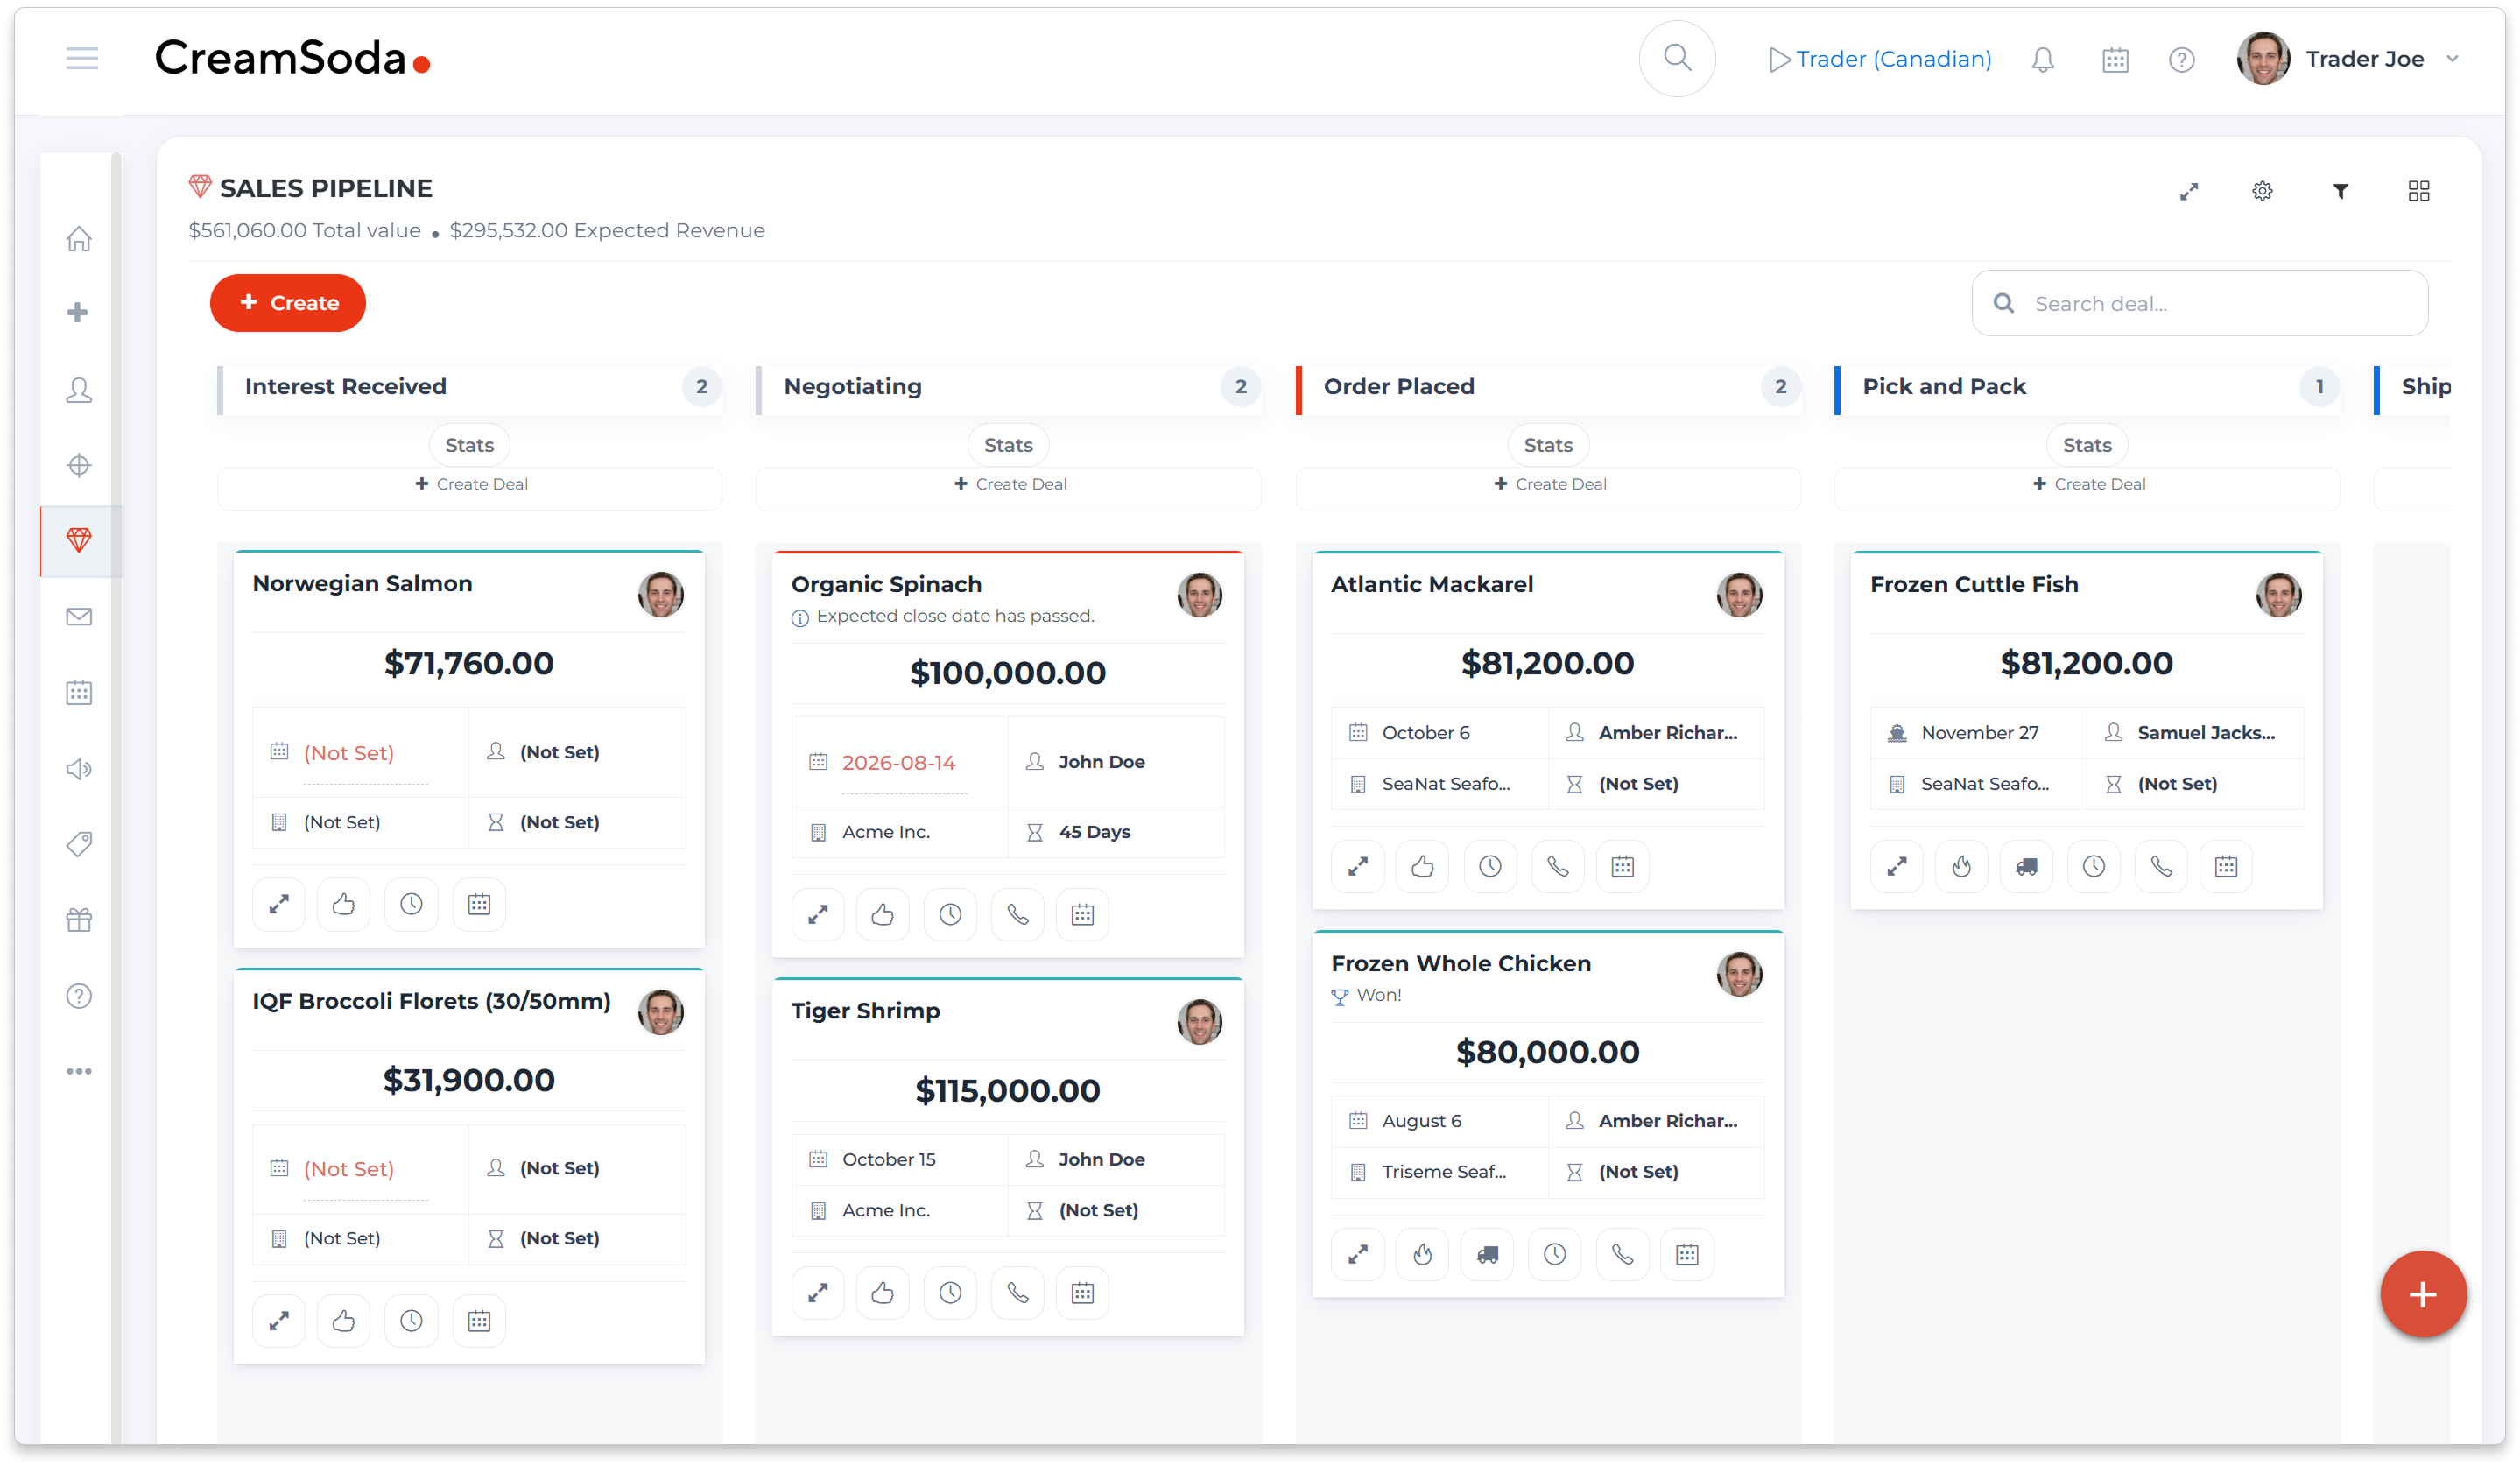
CreamSoda demonstration sales pipeline board showing product deals and expected revenue

Open the deals behind the numbers

What explains this result?
Open won, lost or purchased deal lists from the relevant dashboard totals. Check the customer, linked offer, activity and costs before deciding what to do next.

Explore three product-sales workflows

Business professional reviewing information on a laptop in an office

Trade agents: give the offer a buyer audience

Use earlier offers and deals to choose whom to approach about a supplier opportunity, then keep the buyer’s next question moving.
See the offer-to-buyer workflow
Business professional speaking by phone while reviewing notes and a laptop

Importers: ask buyers before committing to supply

Start requirements conversations with product-related contacts, then assess their answers alongside the supplier quote before buying.
See the buyer-demand workflow
Sales professional on the phone in an office with colleagues nearby

Distributors: pursue the next repeat order

Use successful sales history and useful next actions to choose a relevant account call and keep repeat-product follow-up owned.
See the repeat-sales workflow

Sales reporting questions

What you can review, how to filter results and where the figures come from.
What does CreamSoda’s sales reporting software show?
keyboard_arrow_down

See new deals, open pipeline counts and values, stage conversion, won and lost results by salesperson, and sales-cycle information. Financial reports show recorded revenue, purchasing costs, other deal costs, payments received and calculated profit.

Can I filter reports by date, user and pipeline?
keyboard_arrow_down

Yes. Deal reports have date, user and pipeline controls; financial reports have date and user controls. The figures depend on the view: newly created deals, won or lost deals, and currently open opportunities measure different things.

Can I compare sales performance across team members?
keyboard_arrow_down

Yes. Compare won and lost deal counts or values by salesperson and over time. Use the date and pipeline filters, then review the underlying deals to understand the results.

How is profit shown in financial reporting?
keyboard_arrow_down

Reported profit is recorded revenue minus purchasing value and other deal costs entered in CreamSoda. Claims record problems and their assigned value; they are not deducted by default. Add a claim amount to the deal’s Costs section if you want it included. Check currencies and use your accounting system for reconciliation.

What does sales pipeline reporting show?
keyboard_arrow_down

See open deal counts and values, new-deal trends and stage conversion summaries. Use these to decide which stages or deals need closer attention.

Does CreamSoda replace accounting or ERP reporting?
keyboard_arrow_down

CreamSoda reports on the sales information recorded around customers, offers and deals. Use it alongside your accounting and ERP systems for financial-ledger and operational reporting.

We use cookies to improve your experience. Manage your preferences or accept to continue.

Reject Preferences Accept